Common JVM Optionsλ︎
Examples of commonly used options for any language on the Java Virtual Machine (JVM).
The JVM is excellent at self-optimising its performance. Introducing specific options should only be done if specific resource or performance issues have been identified.
Understanding memory usage has more options to diagnose out of memory errors, garbage collection pauses and JIT compilation
JDK_JAVA_OPTIONS Environment Variable
JDK_JAVA_OPTIONS is the official Environment Variable for setting options when calling java, javac and other Java commands to start running a Java Virtual Machine (Java version 9 onward).
Java heap sizeλ︎
Java Ergonomics should provide sensible default options. Performance analysis of the running code may show advantages of manually setting memory sizes.
Set the initial heap size if memory usage will quickly grow
-Xms – start heap size for JVM, e.g. -Xms2048m sets an initial heap size of 2 GB
-XX:InitialRAMPercentage=n sets the initial heap as n percentage of total RAM
Set the maximum heap size if usage is relatively high under normal conditions
-Xmx – maximum heap size of JVM, e.g. -Xmx2048m
-XX:MaxRAMPercentage=n sets the maximum heap as n percentage of total RAM
-Xss - set java thread stack size
-Xms and -Xmx are commonly used together (where there is a know fixed value for memory resources).
Heap and garbage collectionλ︎
-XX:MaxHeapFreeRatio – maximum percentage of heap free after garbage collection to avoid shrinking.
-XX:MinHeapFreeRatio – minimum percentage of heap free after GC to avoid expansion
VisualVM or JConsole can monitor the heap usage
Container Environmentsλ︎
-XX:InitialRAMPercentage and -XX:MaxRAMPercentage options should be used to set relative limits to the resources available from the host.
Setting specific heap sizes with -Xms and -Xmx is strongly discouraged in Container environments, as resources available to the container from the host could change between deployments (e.g. a change in operational configuration in Kubernettes, etc.)
Stack tracesλ︎
-XX:-OmitStackTraceInFastThrow no StackTrace for implicit exceptions thrown by JVM, e.g. NullPointerException, ArithmeticException, ArrayIndexOutOfBoundsException, ArrayStoreException or ClassCastException.
Reflectionλ︎
--illegal-access option controls how deep reflection warnings are handled.
- permit (default) - generates warning only when the first illegal access was detected
- warn - emit warning after each illegal access detection
- debug - add stack trace to warning
- deny - like debug for the first detection, then killing the program.
Java 16 deprecates
--illegal-accessflag, via work done for JEP403 - may still be useful for 3rd party Java libraries.
Enable class data sharingλ︎
-Xshareclasses enables class data sharing in a shared class cache.
The JVM connects to an existing cache (creating a cache if none exist). Multiple caches specified by adding a sub-option to the -Xshareclasses option.
Handling ‘OutOfMemory’ Errorλ︎
Generating a Heap Dump for out of memory (OOM) issues is recommended for production systems, to provide data for a deep analysis of the problem. Generating a heap dump does not add overhead to the running JVM.
-XX:+HeapDumpOnOutOfMemoryError - trigger heap dump on out of memory failure
-XX:HeapDumpPath=path-to-heap-dump-directory - sets path to write the heap dump file (defaults to directory in which java command was ran from)
A heap dump file can gigabytes in size, so assure that the target file system has sufficient capacity.
-XX:OnOutOfMemoryError="shutdown -r" - restart the process immediately after out of memory failure
The option can take multiple commands, separated by a ;, e.g. -XX:OnOutOfMemoryError="< cmd args >;< cmd args >"
Trace classloading and unloadingλ︎
Identify memory leaks suspected from the JVM Class Loader, e.g. classes are not unloading or garbage collected
-XX:+TraceClassLoading - log classes loaded into the JVM
-XX:+TraceClassUnloading - log classes unloaded from the JVM
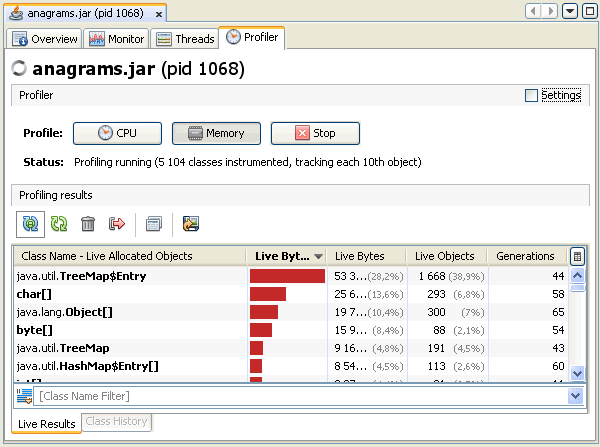
Profilingλ︎
Profiling JVM processes provides a fine-grained view of application execution and resource utilization. Monitor parameters including Method Executions, Thread Executions, Garbage Collections and Object Creations.
-Xprof-Xrunhprof
Consider using a profile tool, such as VisualVM
Skip byte code verificationλ︎
The byte code for each class loaded by the JVM Class Loader is verified, which is a relatively expensive task at startup. Adding classes on the boot classpath skips the cost of the verification, although also introduces a security risk so should only be used when classes have been previously verified.
-Xbootclasspathspecifies classpath entries to load without verification
Profiling an application is a more suitable long term solution than skipping byte code verification
Checks carried out by the verifier include
- Uninitialized Variables
- Access rules for private data and methods are not violated
- Method calls match the object Reference
- There are no operand stack overflows or under-flows
- Arguments to all JVM instructions are valid types
- Final classes are not subclassed and final methods are not overridden
- field and method references have valid names, valid classes and valid type descriptor
Print GCλ︎
Enable the garbage collection logging to capture detailed statistics, e.g. type of garbage collector, how often memory is restored and how much time memory was held for. Garbage collection can last several milliseconds, so logging is useful for latency-sensitive processes.
-verbose:gc- logs garbage collector runs and how long they're taking.-XX:+PrintGCDetails- includes the data from -verbose:gc but also adds information about the size of the new generation and more accurate timings.-XX:-PrintGCTimeStamps- Print timestamps at garbage collection.
Consider using LMAX disruptor for a Garbage Collection free architecture for ultra latency-sensitive applications
Deprecated: PermGen Sizeλ︎
-XX:PermSize - size of PermGen space where string pool and class metadata is saved.
Option is useful for web servers which load classes of a web application during deployment (e.g. deploying a jar or war to Tomcat).
Metaspace has taken over PermGen space in Java 8 onward